How to Measure Carbon Footprint of Your Cleaning Equipment - Nilfisk CO₂ Calculator
Do you know the carbon footprint of your cleaning equipment?
If you run cleaning operations in the UK and beyond, you’re likely under pressure to evidence emissions and meet ESG targets. At the same time, you need to keep floors spotless and budgets under control. A practical way to achieve all three is to measure—then manage—the carbon footprint of your cleaning equipment. The free Nilfisk CO₂ calculator is designed precisely for this purpose: it reveals product-level emissions data, enabling you to choose better cleaning equipment, demonstrate sustainable progress and strategy, and secure sustainable procurement tenders.
CO2 Calculator Dashboard
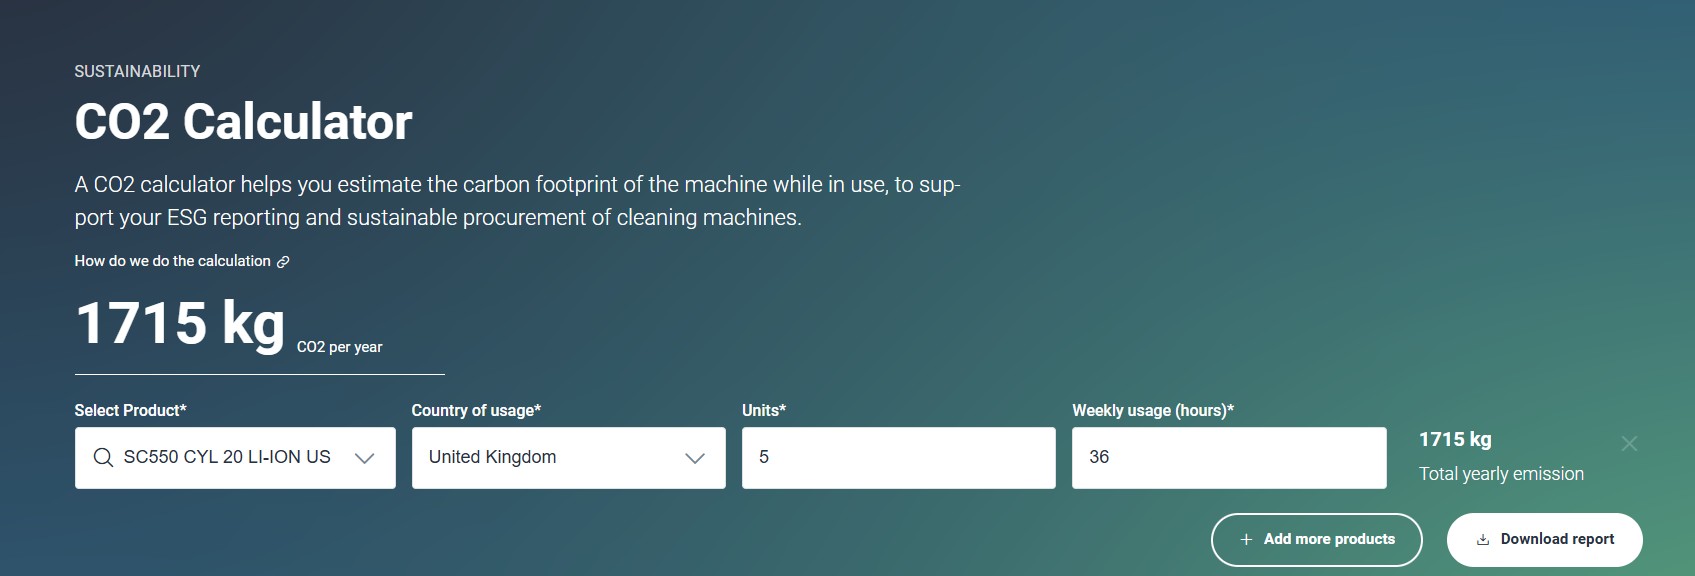
We use 'CO₂e' (carbon dioxide equivalent), which combines all greenhouse gases from equipment manufacturing, use, and disposal into a single comparable metric—not just the CO₂ from electricity consumption.
“Nilfisk CO₂ calculator that enables customers and sales teams to access product-level emissions data based on the actual usage of the equipment,” says Malene Thiele, VP, Nilfisk Global ESG & Sustainability.
Why carbon footprint measurement matters in cleaning
Your machines are workhorses—but they’re also energy users. Electricity mix, battery charging, brush pressure, and usage patterns all influence emissions. Measuring the footprint of equipment gives you a reliable, like‑for‑like basis to:
- Set a baseline for Scope 1, 2, and 3 reporting
- Compare models by real‑world CO₂e per hour or per m² cleaned
- Prioritise upgrades with the biggest emissions and cost impact
- Create auditable, downloadable reports for ESG and customer bids
Nilfisk’s leadership stance is clear.
According to SBTi, “Nilfisk commits to reduce absolute scope 1 and 2 GHG emissions 90% by 2040 from a 2021 base year.”
Understanding emissions across the cleaning lifecycle
Cleaning emissions come from three places: direct fuel use, purchased electricity, and upstream/downstream activities (from manufacturing to end‑of‑life). Here’s a quick map:
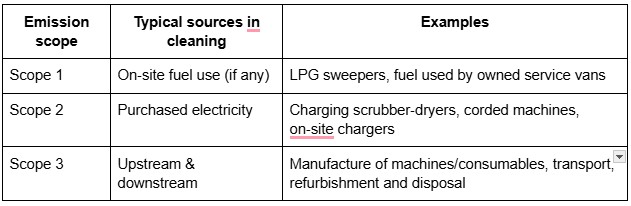
Different machine categories contribute differently. Battery scrubber‑dryers are dominated by Scope 2; combustion sweepers lean into Scope 1; consumables, chemicals, and logistics sit in Scope 3.
Meet the Nilfisk CO₂ calculator
The Nilfisk CO₂ calculator is a usage‑based tool designed for commercial and industrial cleaning. It brings clarity to questions like “What’s the annual CO₂ for this model in our sites?” and “How much could we cut by switching to a different machine or reducing charge losses?”
- Product coverage: Nearly all Nilfisk professional cleaning products
- Usage‑based logic: Reflects hours, modes, and electricity mix
- Downloadable reports: Ready for ESG documentation and tenders
- Side‑by‑side comparisons: Model‑to‑model clarity for procurement
“The CO₂ calculator provides annual emissions data for nearly all Nilfisk professional cleaning products, allowing UK customers to download reports for their own ESG documentation.”
“Getting an A- from CDP for the fifth consecutive year showcases our commitment to climate action and demonstrates that data not only drives the ability to compare performance on companies’ carbon footprint disclosure, but also drives environmental action,” says Malene Thiele, VP, Nilfisk Global ESG & Sustainability.
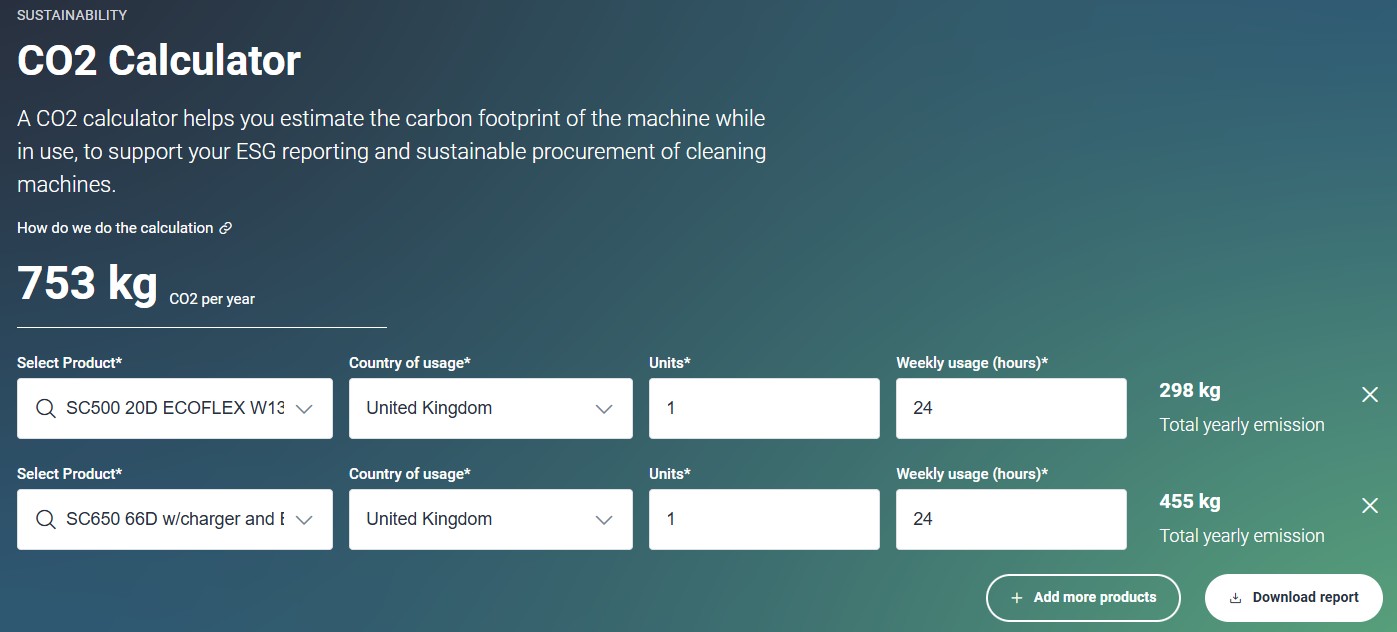
Comparison View - Nilfisk Scrubber Dryers Showing Annual kg CO₂ and kWh
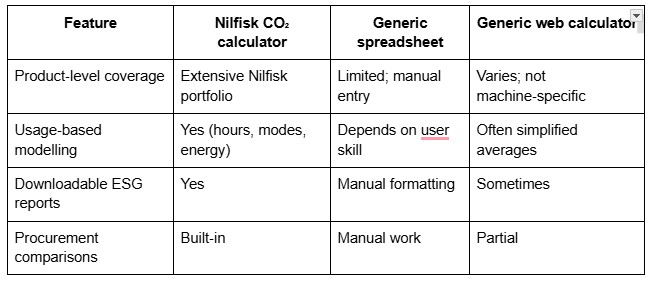
Choosing the right calculator (and why usage‑based wins)
Not all calculators are built for cleaning. Look for three key features: coverage of your exact machines, usage-based logic, and exportable reports suitable for ESG packs.
Industry context: credibility that helps you win
For UK and Ireland buyers, supplier credibility matters. Nilfisk’s climate governance provides assurances alongside the tool itself.
- CDP leadership: A‑ score for five consecutive years (2020–2024).
- SBTi Net-Zero: 1.5°C‑aligned near‑term target; net‑zero by 2040.
- Operational scale: 4,700+ employees; UK important market (c.4% of global revenue, 2023).
“Nilfisk has maintained an A- climate score from CDP for five consecutive years (2020–2024), ranking it in the leadership bracket for global environmental disclosure performance.”
Technology on the horizon: IoT, robotics, and AI
As fleets become smarter—through robotics, telematics, and IoT—you’ll be able to pull actual run‑time and energy data straight into emissions calculations. Expect tighter loops: measure → adjust settings → verify. AI can also surface anomalies (e.g., a site using 30% more kWh per m² than peers) so you can intervene early.
Quick start: put the Nilfisk CO₂ calculator to work
- Start small: Pick two high‑usage machines at one site.
- Get the data: Hours, days, and charging pattern.
- Run and export: Generate the report and set a 12‑month reduction target.
- Share the win: Add the report to your ESG pack and procurement playbook.
When you’re ready, scale across sites and standardise reporting. It’s the same simple process every time.
Try the Nilfisk CO₂ calculator and turn sustainability goals into measurable, repeatable action.
FAQ: your top questions answered
Q: How accurate is the Nilfisk CO₂ calculator?
A: It uses usage‑based inputs and recognised emission factors. Accuracy depends on the quality of your data (especially hours, modes, and energy source). Keep assumptions consistent and your results will be decision‑grade.
Q: Does it help with UK ESG requirements?
A: Yes. Reports are downloadable for inclusion in ESG packs and tenders, supporting transparency for Scope 2 and informing Scope 3 where relevant.
Q: Can I compare two models before buying?
A:That’s one of the best uses—run scenarios, compare annual CO₂e and intensity metrics, and choose the lower‑emission option that still meets your standard.
Q: What if my sites use different electricity tariffs or mixes?
A: Use UK defaults or input site‑specific data where you have it. The more local your inputs, the more precise the output.
Q: Will it cover all Nilfisk professional products?
A: Equipment coverage extends to nearly all Nilfisk professional cleaning products, which is ideal for portfolio assessments.
Q: How often should I re‑run calculations?
A: Quarterly is sensible for most teams; monthly if you’re running improvement programmes or major tenders.
Q: Can this link to IoT or robotic data?
A: You can use telematics exports to strengthen inputs today; expect tighter integrations as fleets digitise.
Q: What’s the internal time commitment?
A: Initial setup per machine is minutes if you have usage data at hand. After that, it’s rinse‑and‑repeat.
Q: Does Nilfisk’s climate governance matter to buyers?
A: It helps. Nilfisk’s leadership in CDP rankings and SBTi-approved climate targets underline a strong, long-term commitment to sustainability. Explore how our customer and partnership initiatives support the journey towards net-zero.
Where do I start?
Pick your highest‑usage site, baseline two machines, set a realistic 12‑month reduction target, and build from there.
Key takeaways
- Measure what matters: usage‑based emissions for each machine.
- Document and share: download reports to strengthen ESG and tenders.
- Act on the data: optimise settings, training, and model choices.
- Repeat quarterly: track improvements and compound the gains.
Next step: use the Nilfisk CO₂ calculator on your top two machines and turn insight into action.
Contact Us: Learn more about our sustainability partnership approach or speak to a Nilfisk specialist.